San Francisco Real Estate Market Update - July

Golden Gate Bridge and San Francisco skyline across the bay, seen from a green coastal park.
San Francisco market update over an aerial city view with the skyline and Bay at golden hour.
Kat Rains and BarbCo Real Estate Group
Stay informed and ahead of the curve, this month’s market update brings you the latest local insights that shape our real estate landscape. From interest rate shifts to inventory changes, we break down what it all means for you.
 
Whether you’re thinking of buying, selling, or simply keeping an eye on the market, we’re here to guide you with clarity and confidence.
 
Let’s navigate the market together, one smart move at a time.
 
- Kat Rains, LIC #02035991
The Big Story
Quick Take:
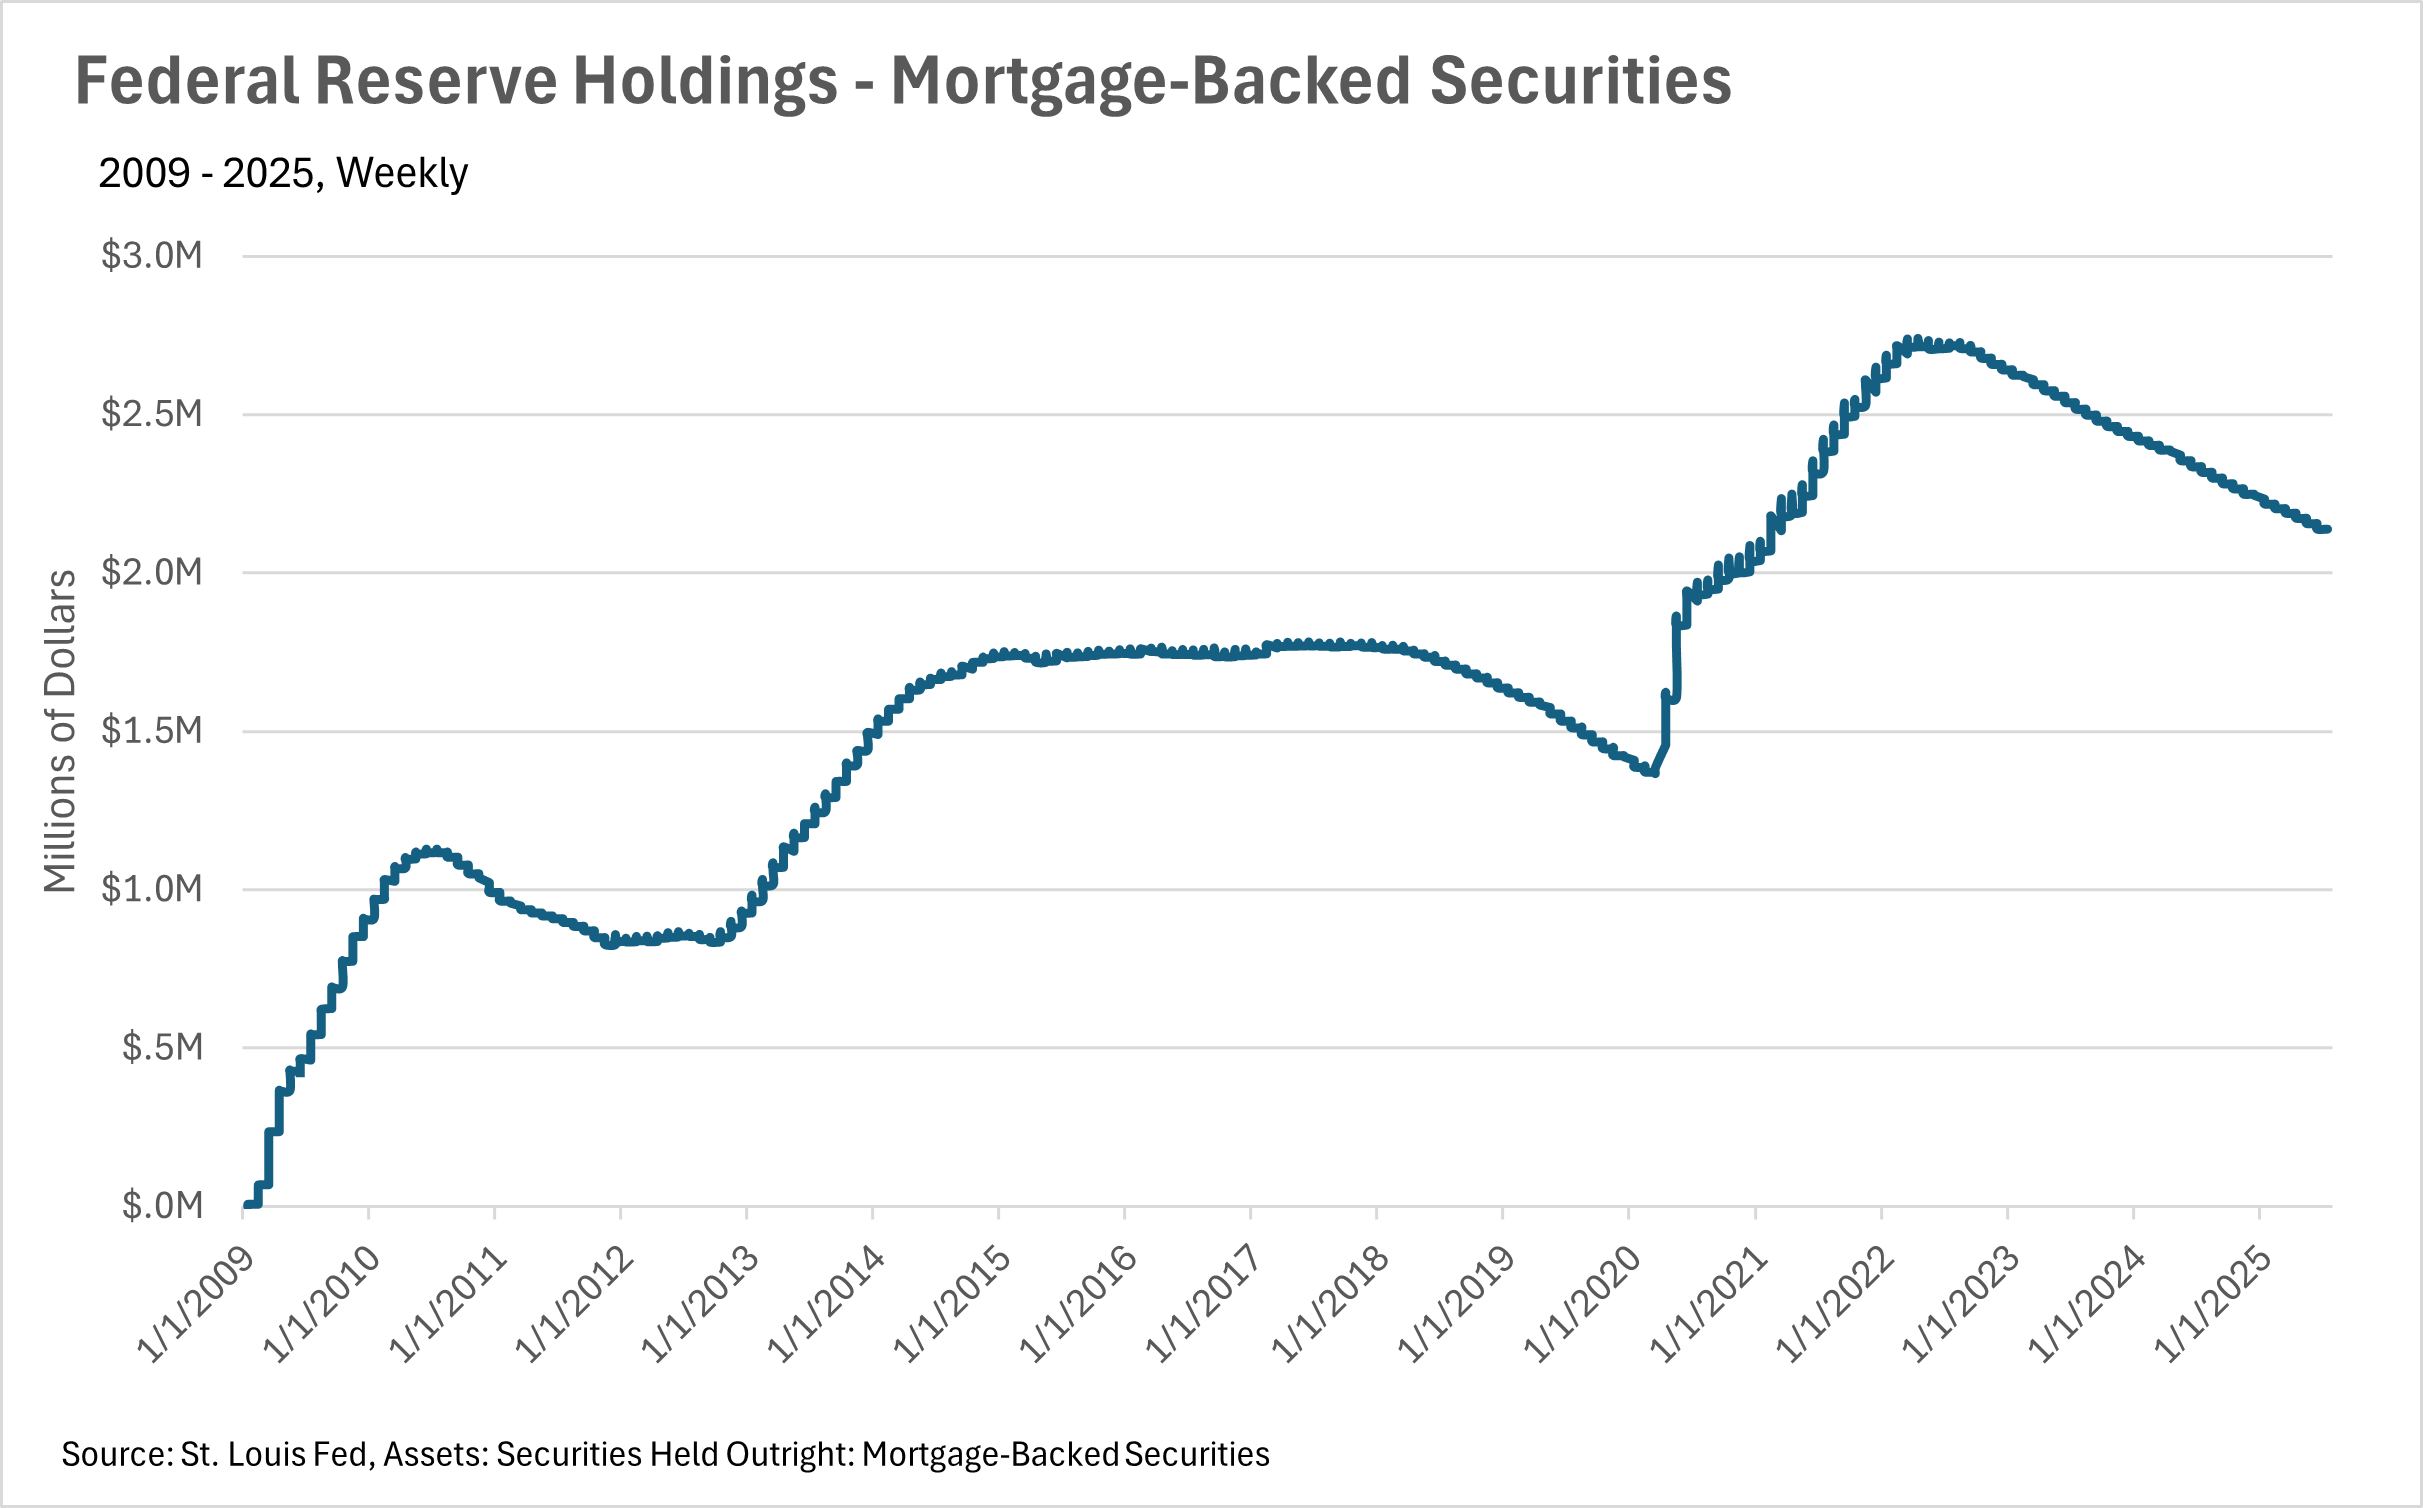
  • Mortgage rates have continued to hold the mid-six percent range that we’ve seen for over six months.
  • The recent global economic and geopolitical instability that we’ve seen likely won’t help the market, as uncertainty may lead people to stay where they are.
 
Note: You can find the charts & graphs for the Big Story at the end of the following section.
*National Association of REALTORS® data is released two months behind, so we estimate the most recent month's data when possible and appropriate.
 
Mortgage rates remain stagnant in the mid-six percent range
For the past few months, mortgage rates have remained fairly stable, in the mid-six percent range. Although the stability that we’ve seen is a good thing, the levels they’ve stabilized at are quite a bit higher than recent historical averages. This, of course, is one of the leading causes of the affordability issues that we’ve seen recently.
 
It is worth noting, though, that we might see some discounted rates toward the back half of the year. Although the Fed has not touched the federal funds rate in nearly a year, the Fed chairman has signaled that one to two rate cuts are expected by the end of the year, so long as there aren’t any further spikes in inflation.
Global economic and geopolitical instability are making both buyers and sellers more cautious
In any market, but especially the real estate market, instability is incredibly detrimental. Given the recent rise in uncertainty around tariffs and employment, coupled with continued instability in Europe and the Middle East, both buyers and sellers have become much more cautious. Inventories are growing throughout California and the broader United States. However, for those who have the capital and a long time horizon, times like these can represent excellent buying opportunities, as good deals are easier to come by.
 
However, it’s important to note that this is just what we have been seeing at the national level. California markets have largely remained resilient, which we’ll delve into more in the local lowdown section below.
Big Story Data
Chart of Federal Reserve mortgage-backed securities holdings, peaking in 2022 before declining through 2025.
The Local Lowdown
Quick Take:
  • Median sale prices continued to increase throughout San Francisco in the month of June.
  • Inventory continues to be a huge issue in San Francisco, as levels continue to dwindle.
  • Due to the inventory constraints in the area, listings are scooped up off the market at breakneck speed.
 
Note: You can find the charts/graphs for the Local Lowdown at the end of this section.
Condo values have increased by more than 10% over the course of the past year
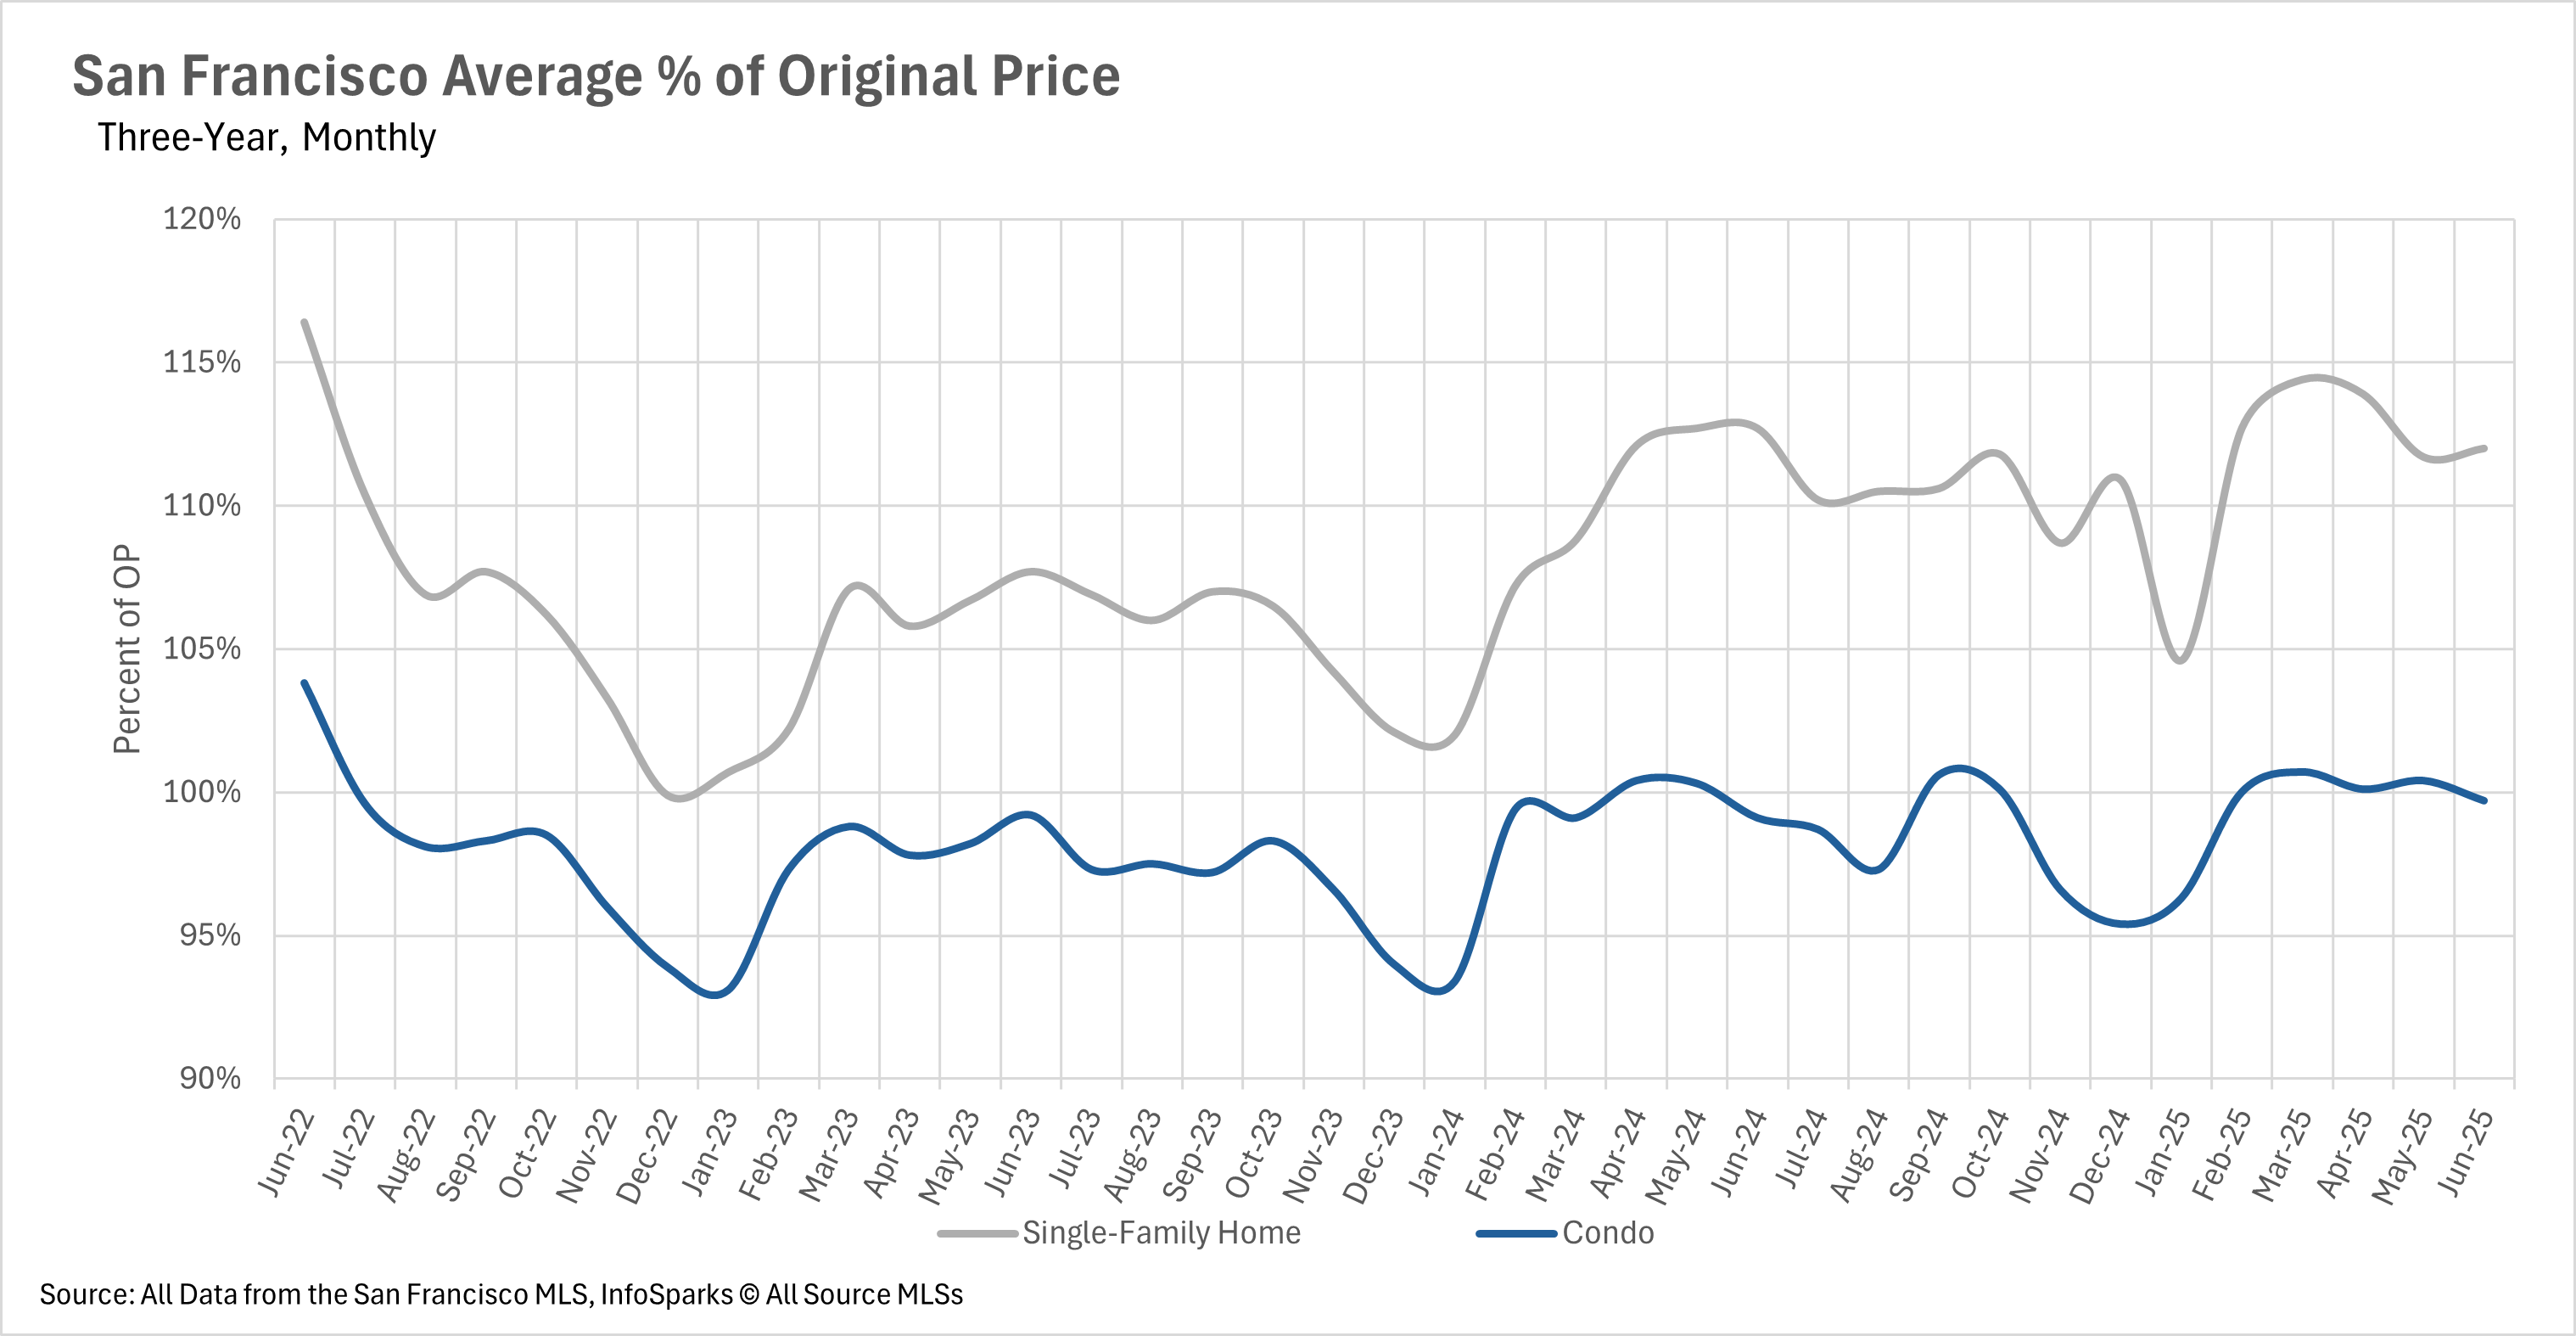
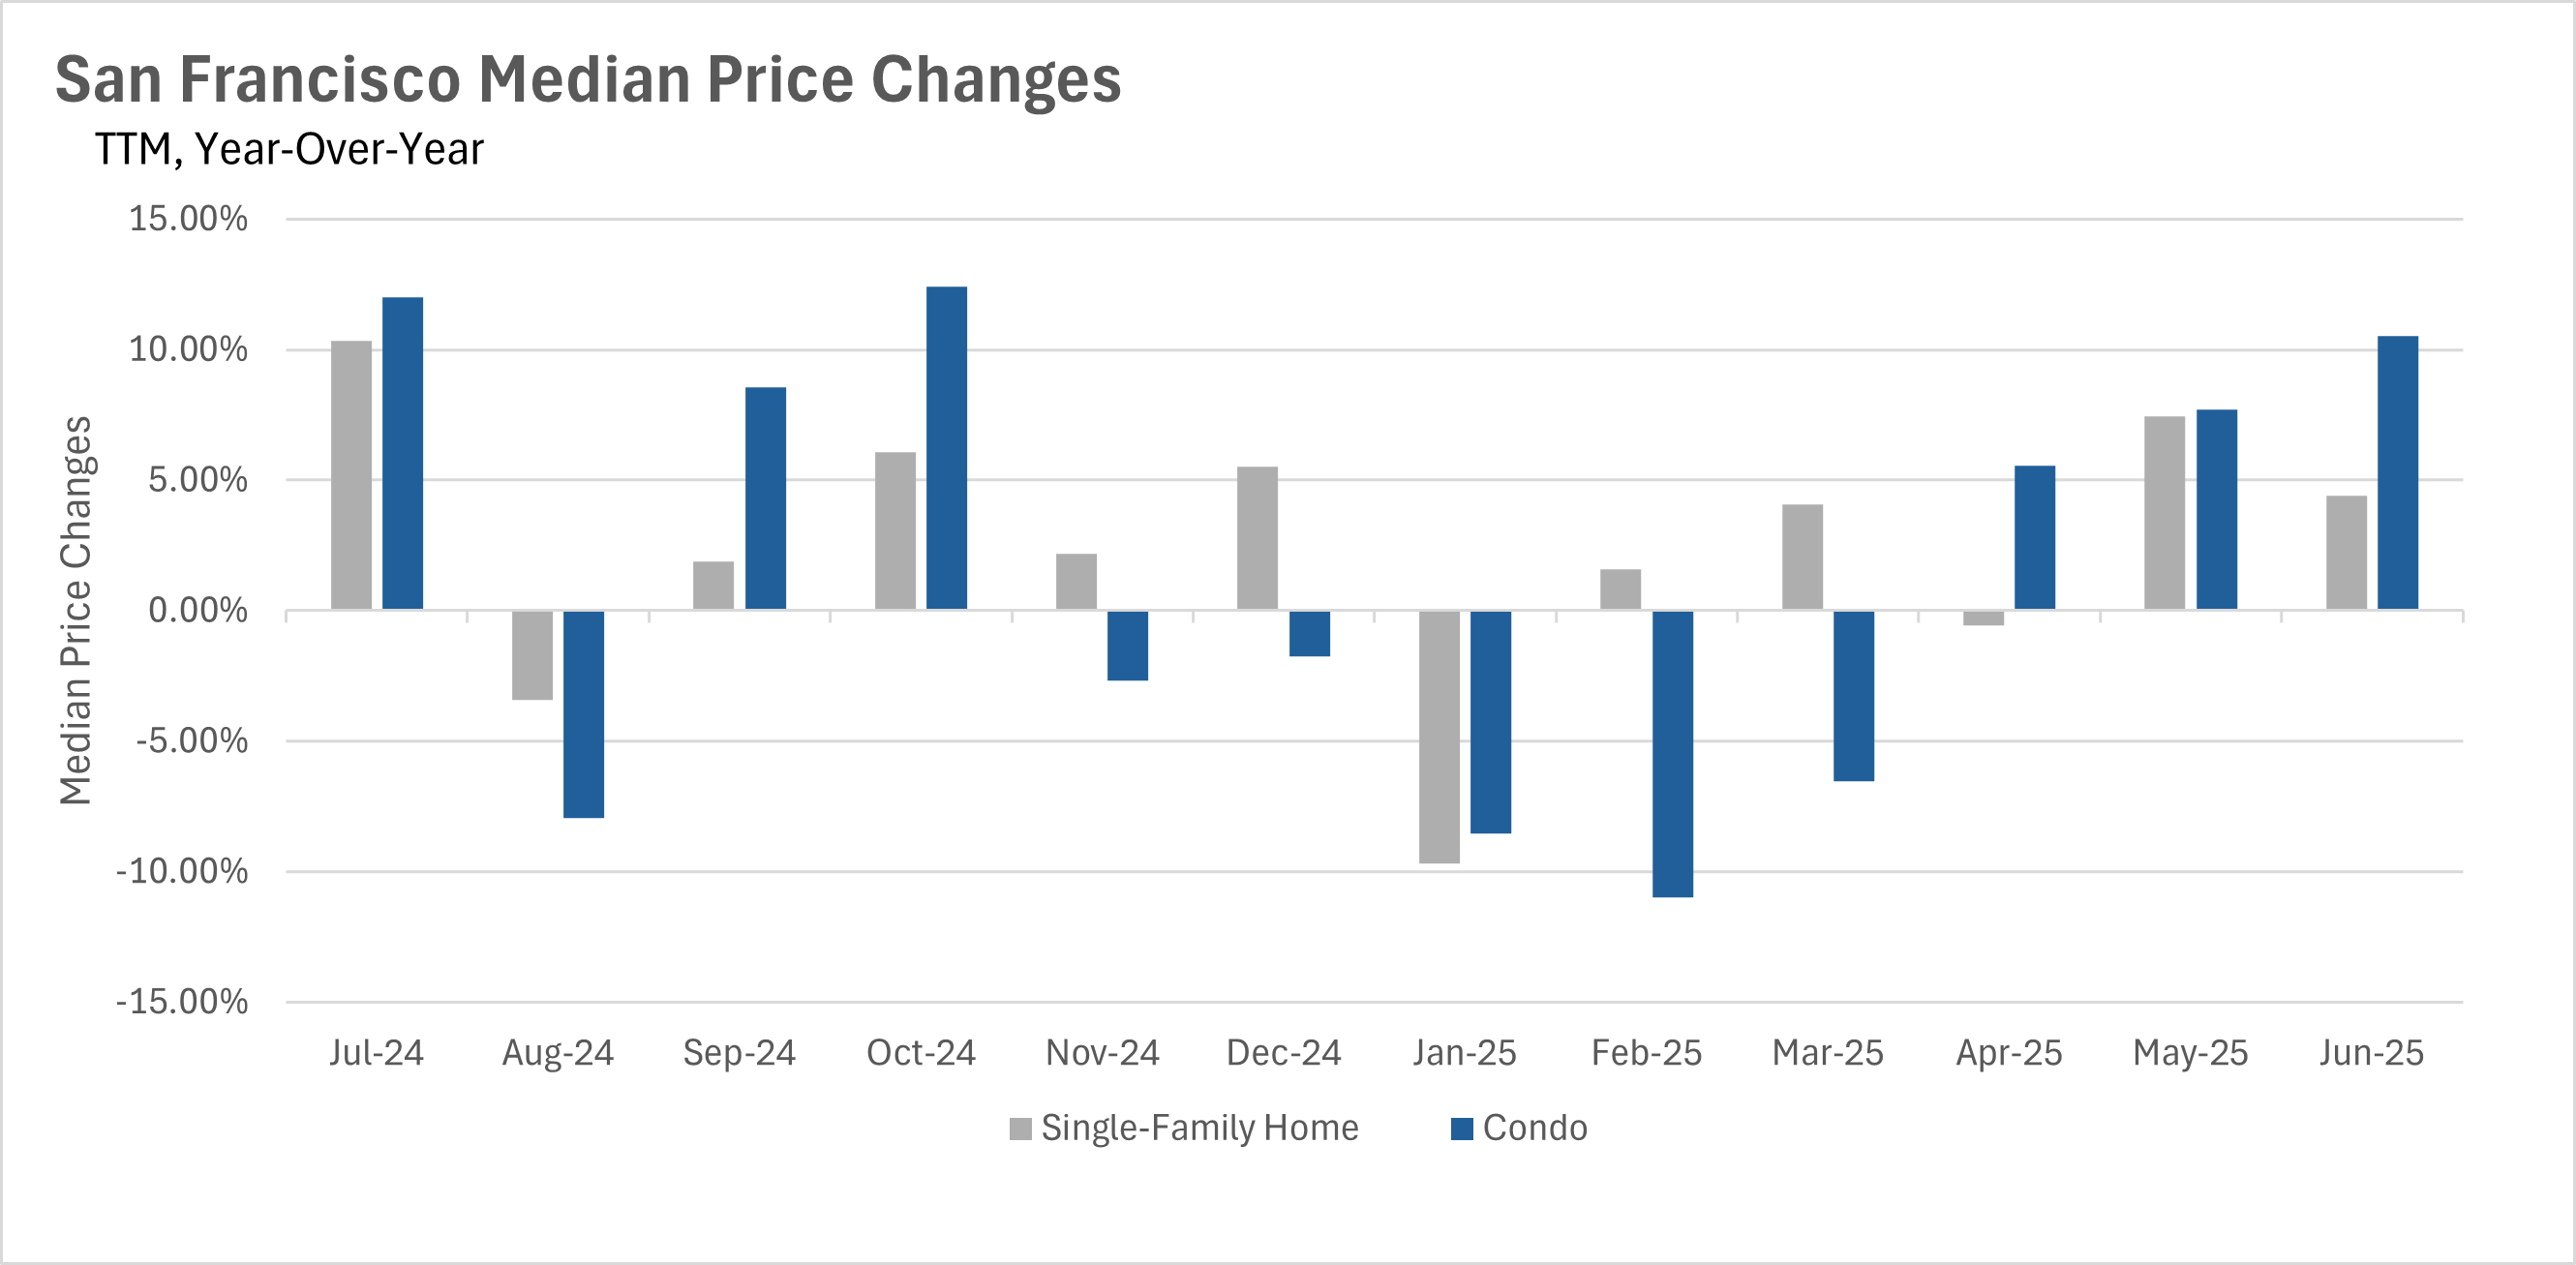
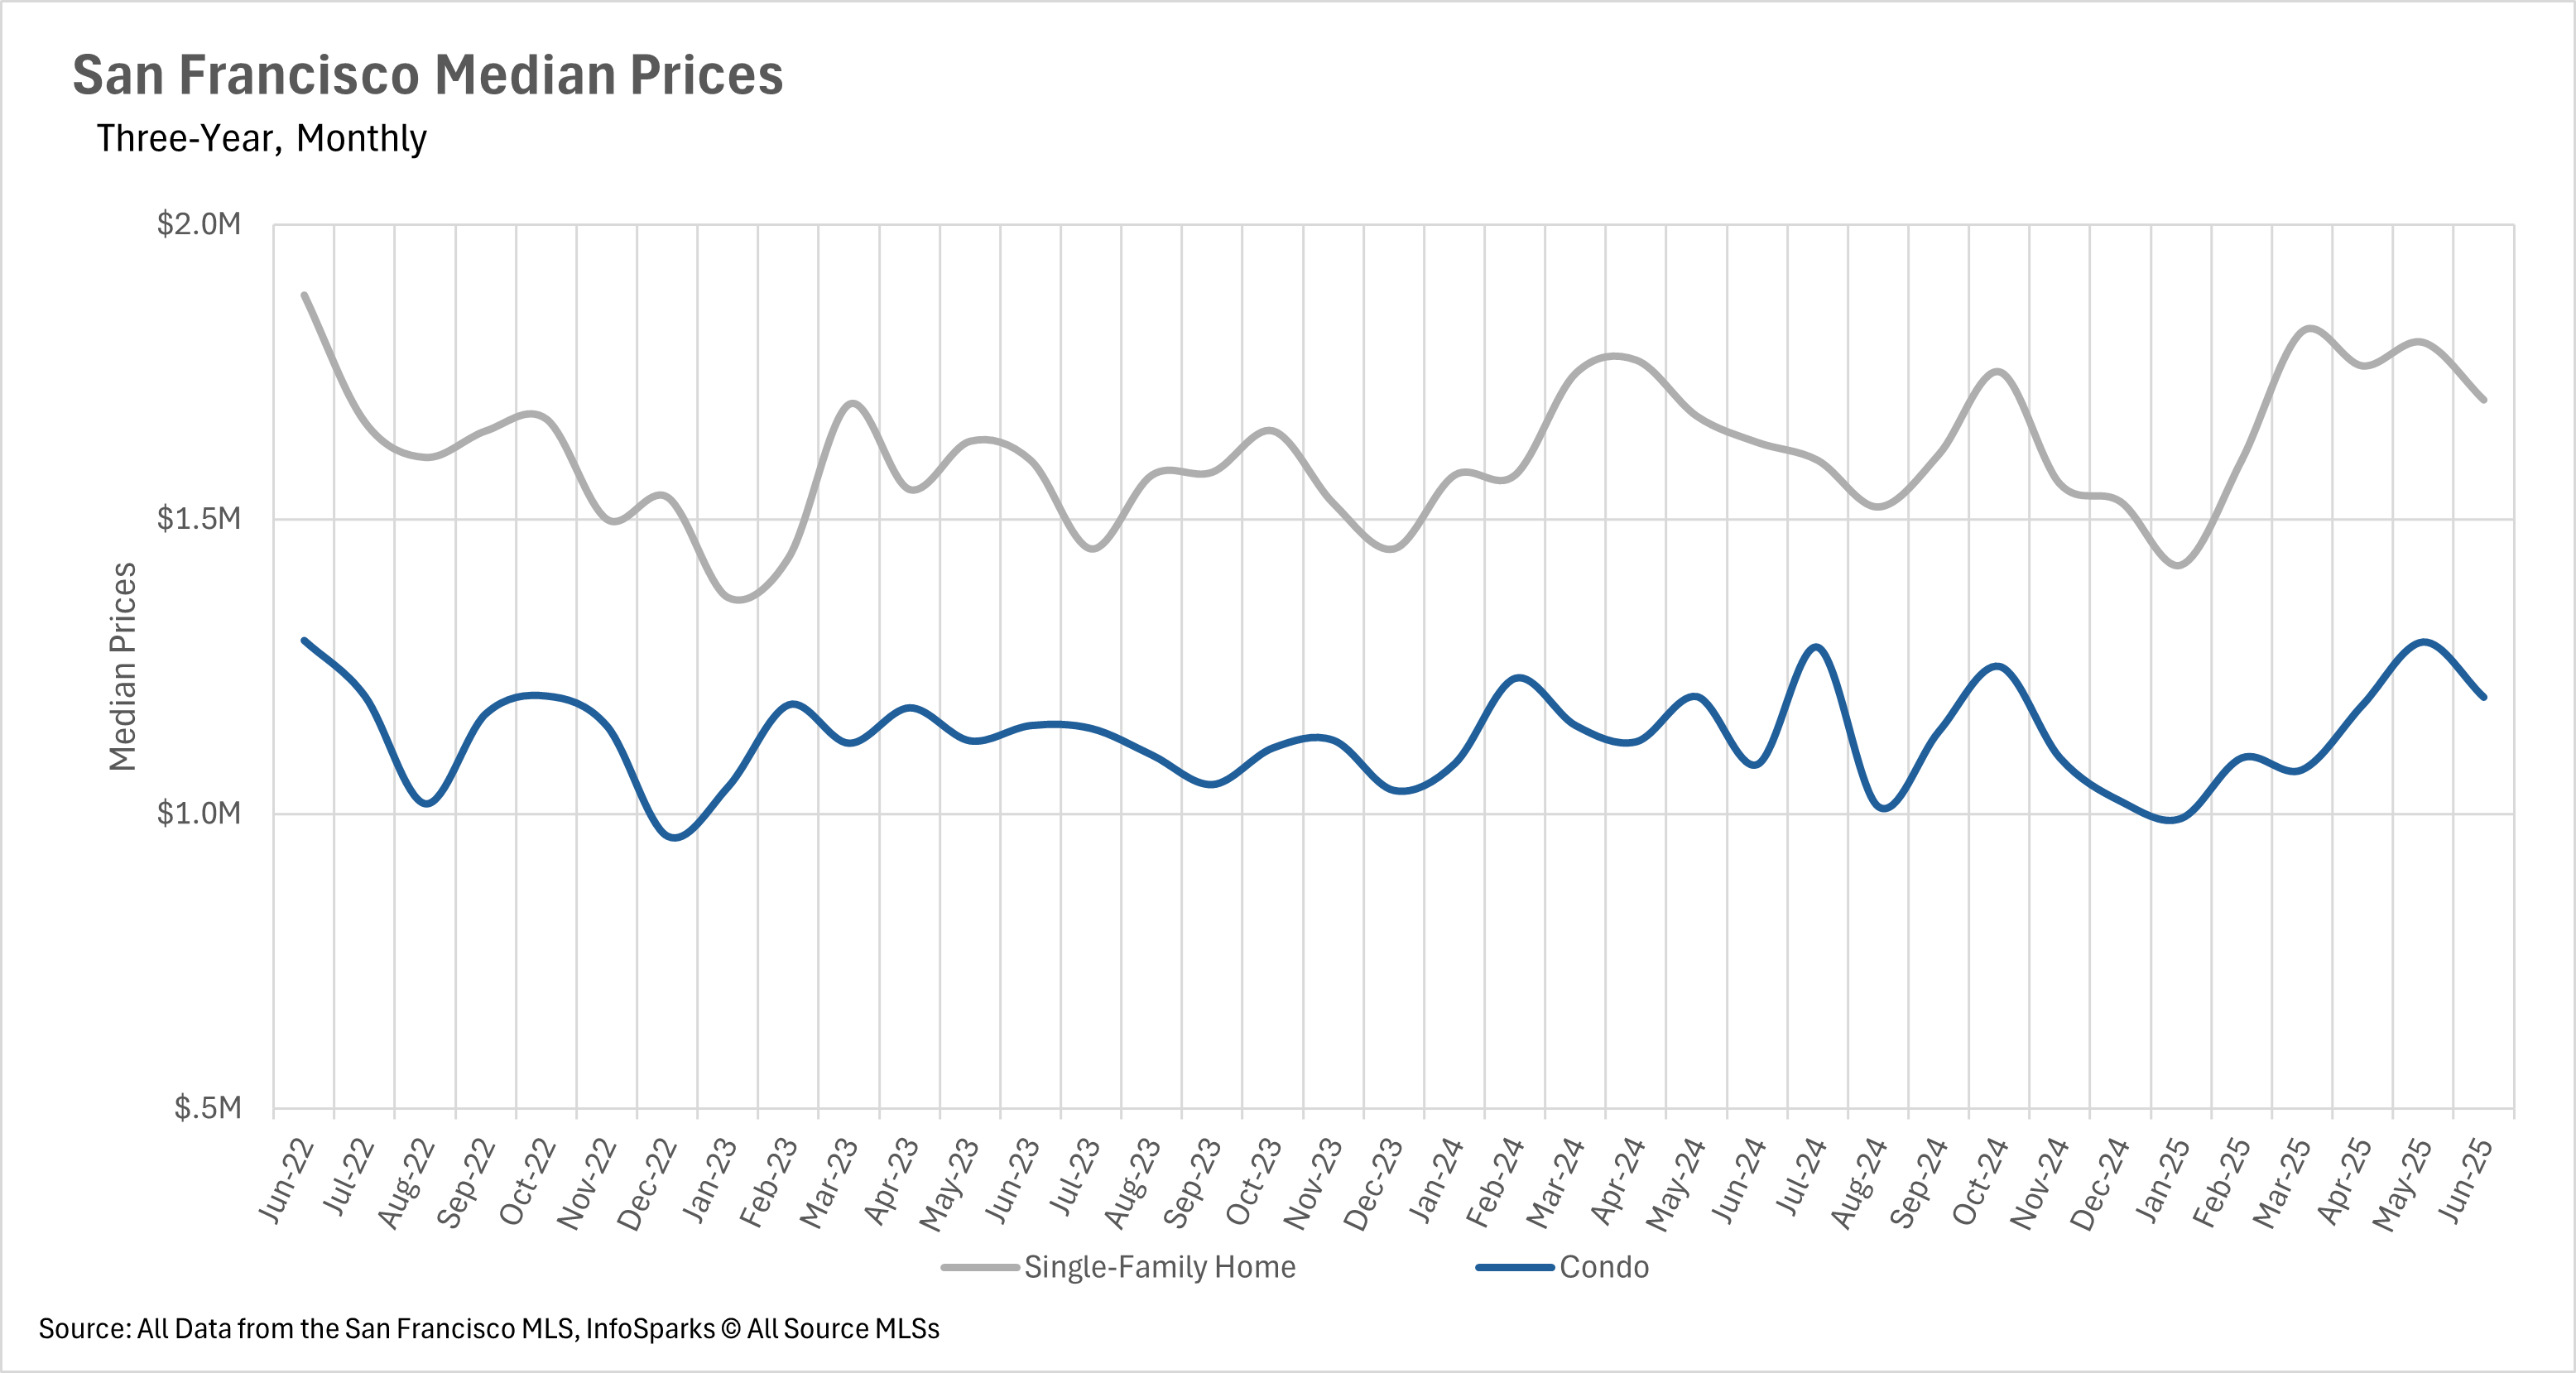
Median sale prices have been on the rise over the past few months in San Francisco, and there was no exception in the month of June. Single-family home median sale prices rose by 4.42% on a year-over-year basis, while condo median sale prices rose by 10.52%. Additionally, the average single-family home sells for 112% of the original listing price, while the average condo sells for a slight discount, at just 99.7% of the original listing price.
Inventories continue to dwindle, as homeowners are reluctant to sell their properties
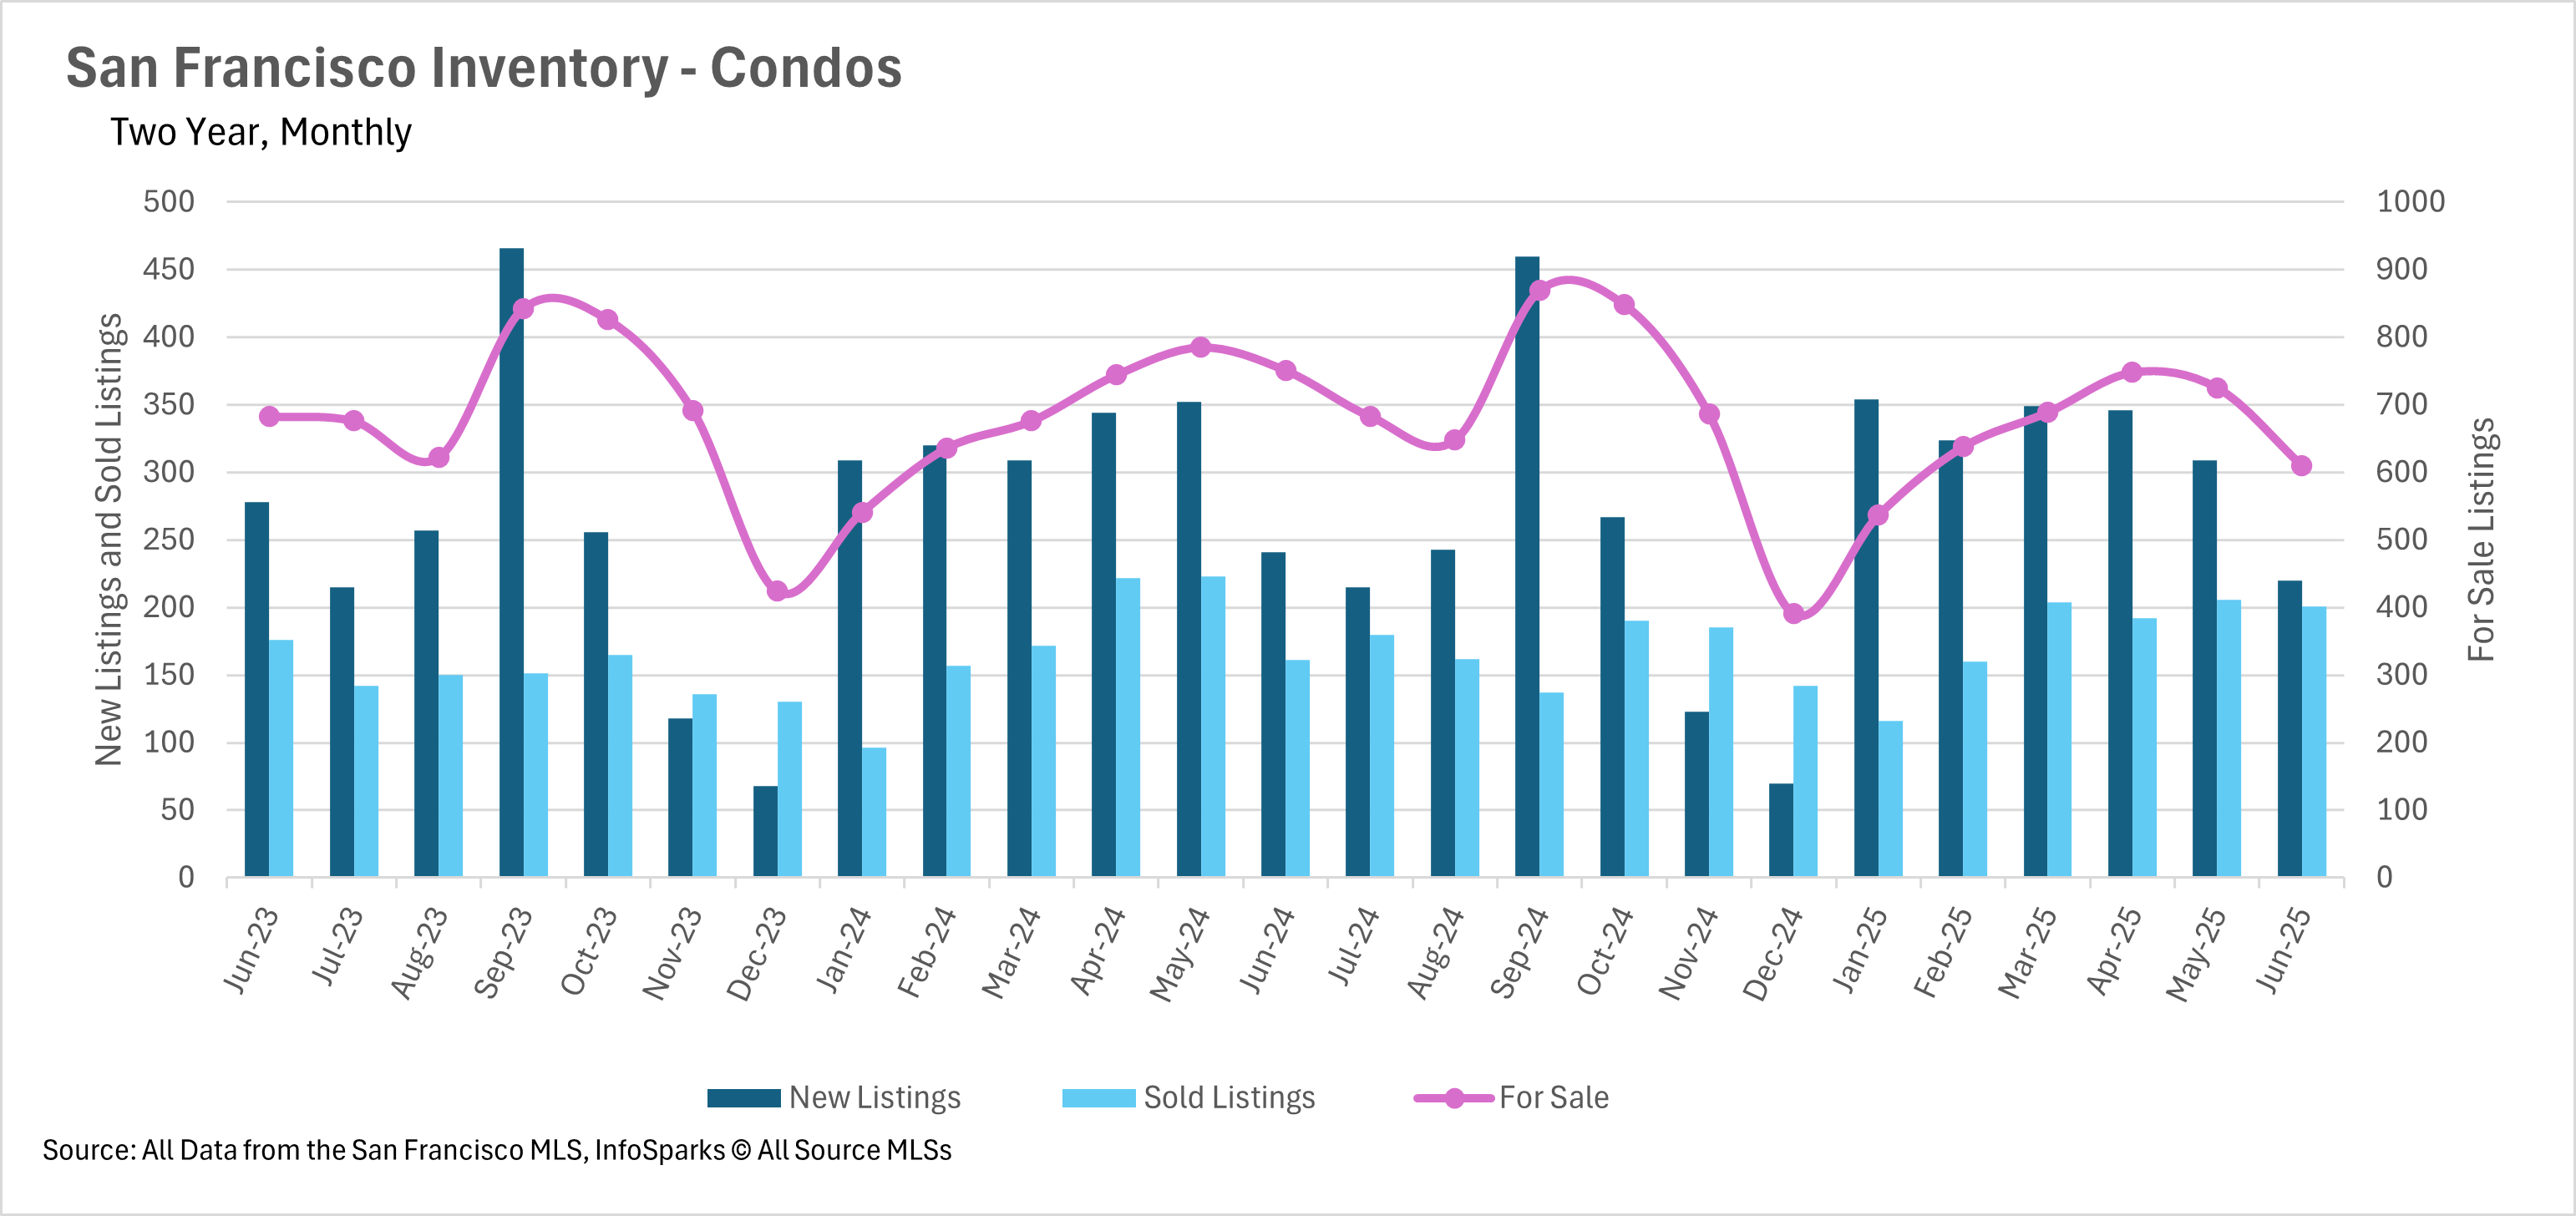
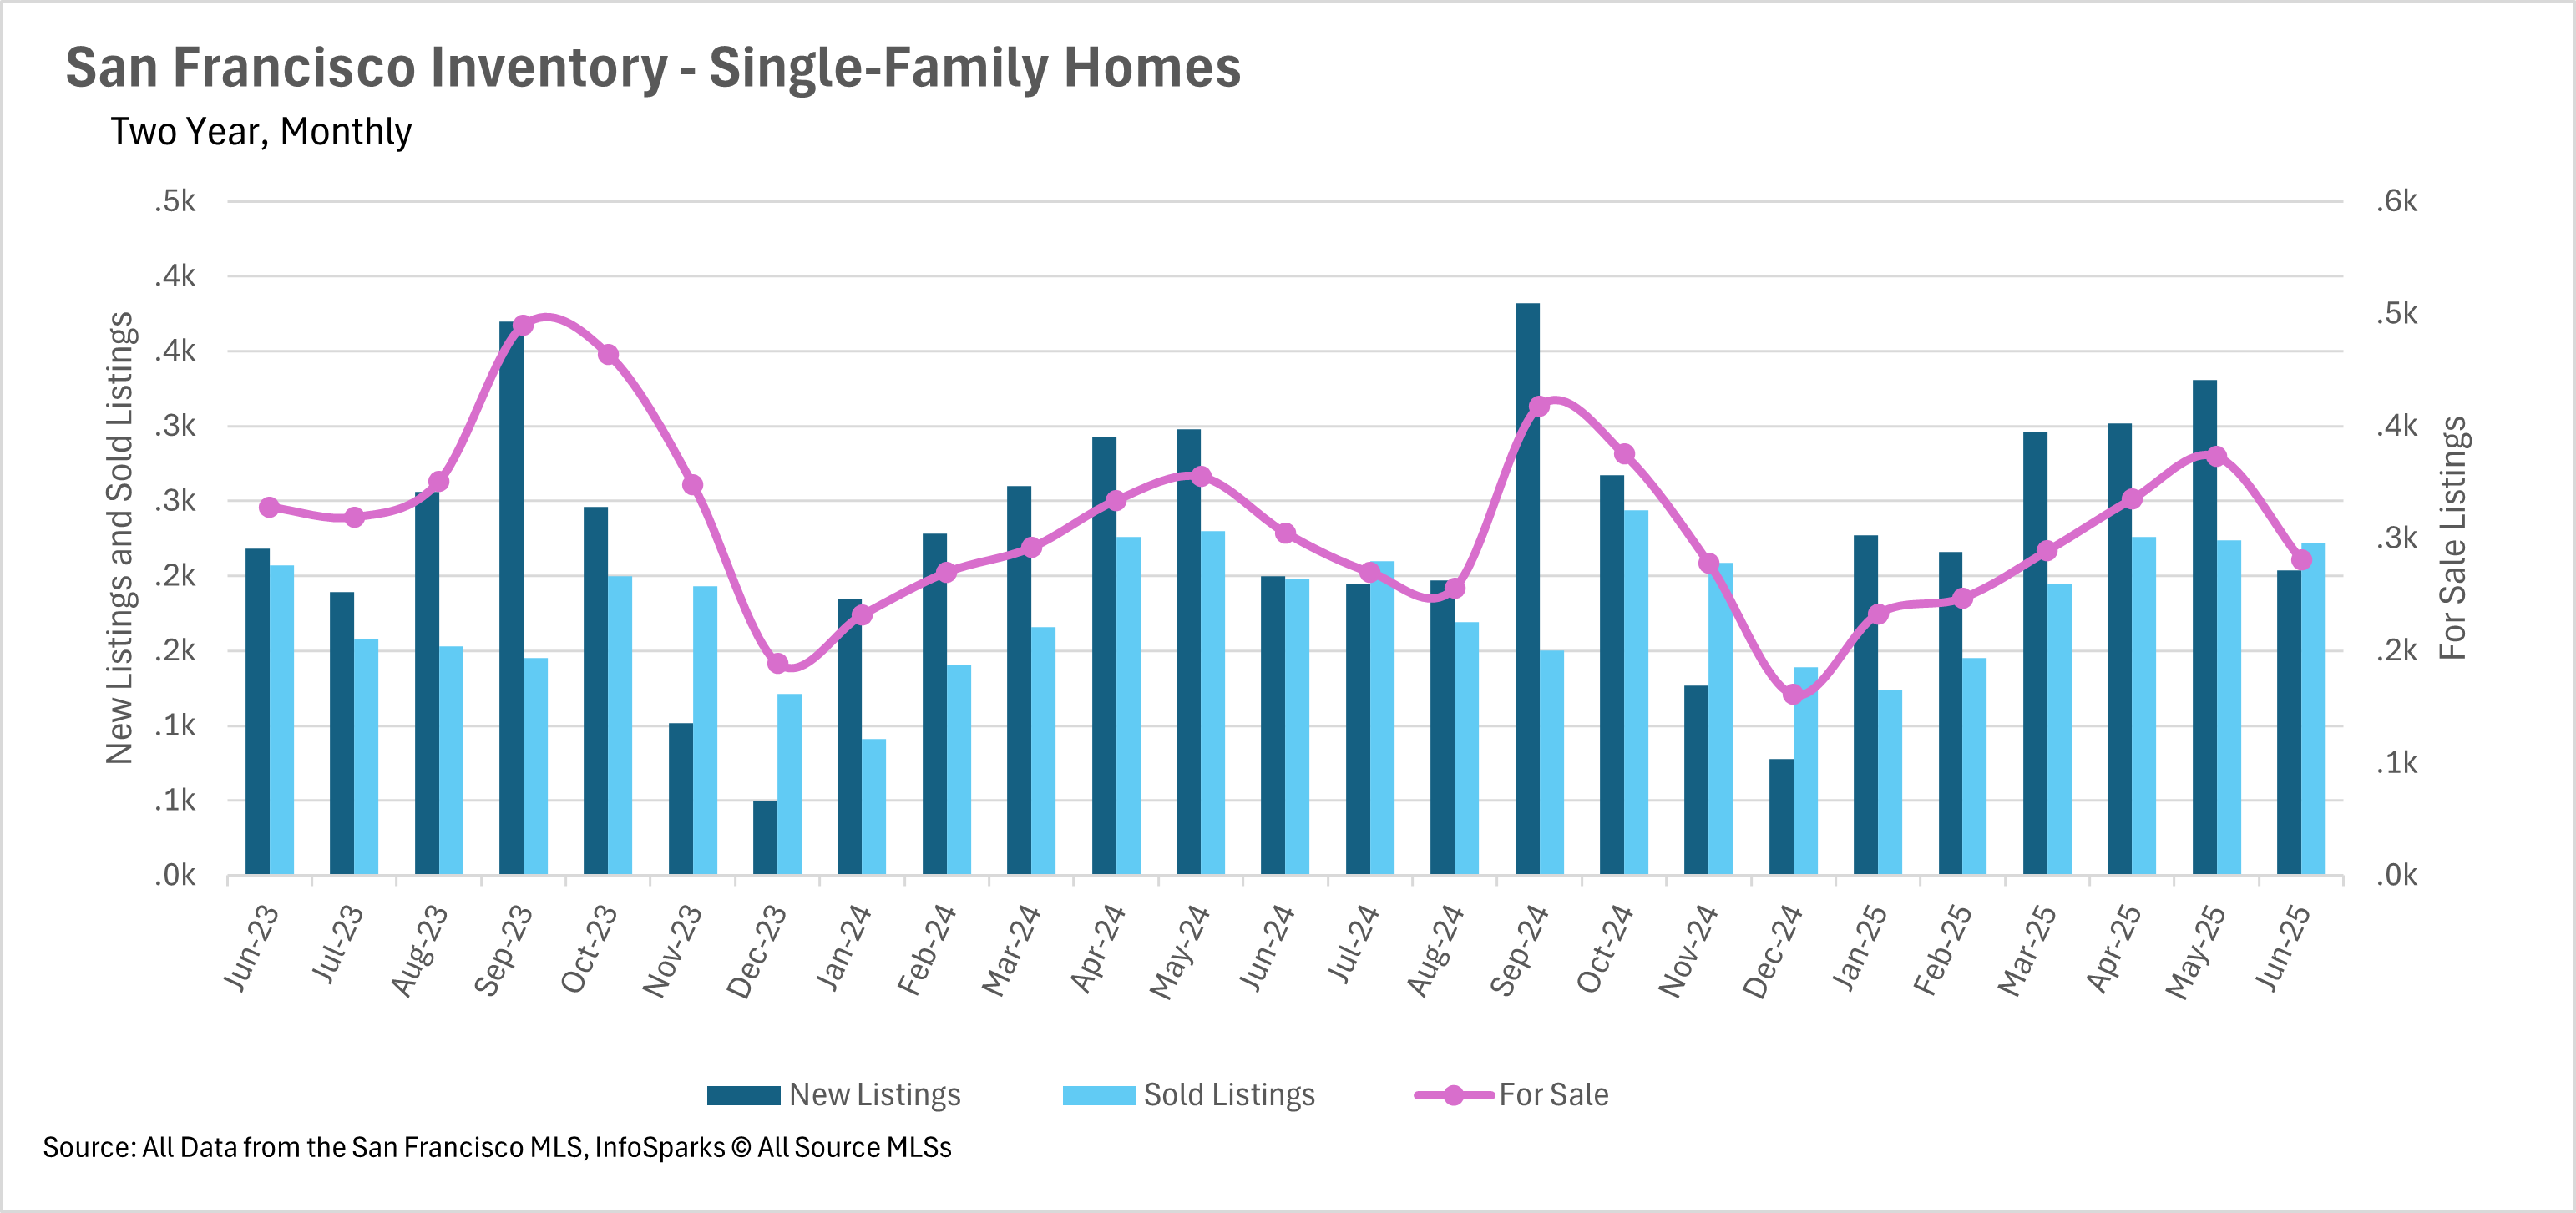
This rise in prices that we’ve seen has been fueled by a lack of new supply hitting the market. Each and every month, we’ve seen inventories slowly get bought up and seemingly taken off the market for good. In the month of June, we saw 7.87% fewer single-family homes on the market when compared to this time last year. When we turn to the condo market, we see 18.77% fewer listings on the market at the end of June.
San Francisco remains one of the few markets where we’re seeing listings spend less time on the market
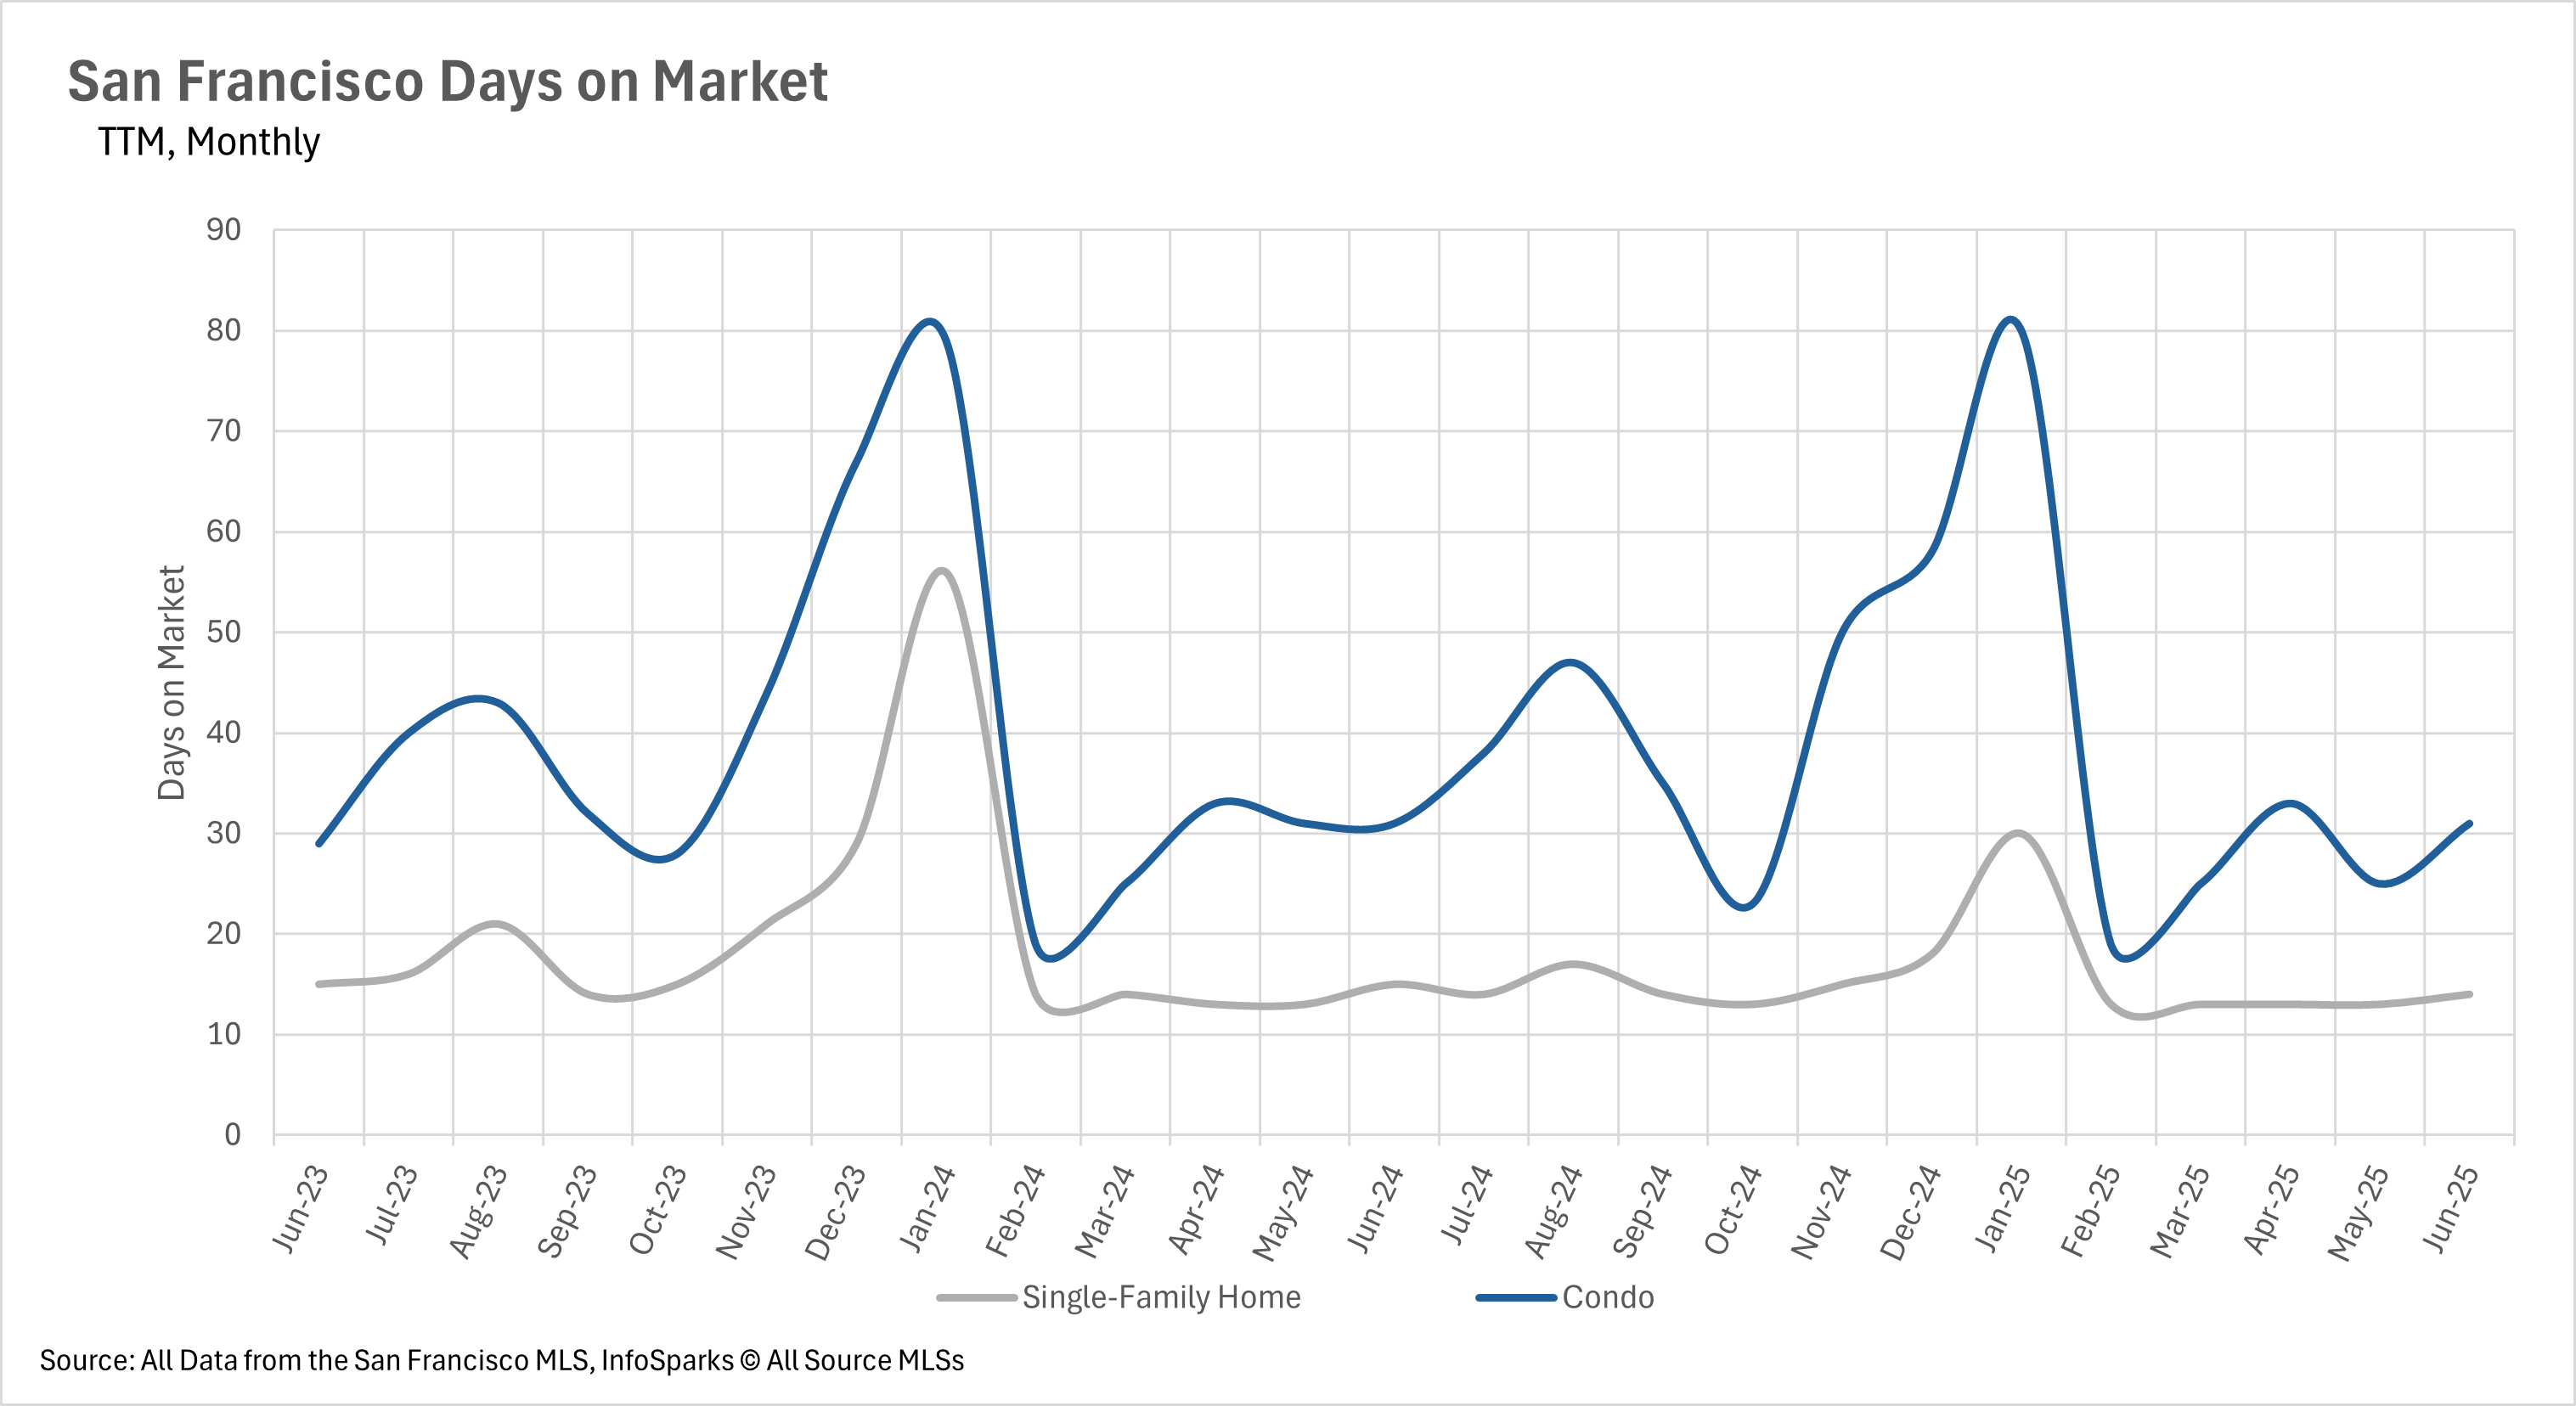
As you might expect, given the rising prices and inventory issues that we’ve been observing throughout San Francisco, listings are being bought up incredibly quickly. The average single-family home spends just 14 days on the market, while the average condo spends 31 days on the market. These figures represent a year-over-year decrease of 6.67% in the single-family home market and no change in the condo market.
The single-family home market continues to be seller-dominated, while buyers have a bit of leverage in the condo market
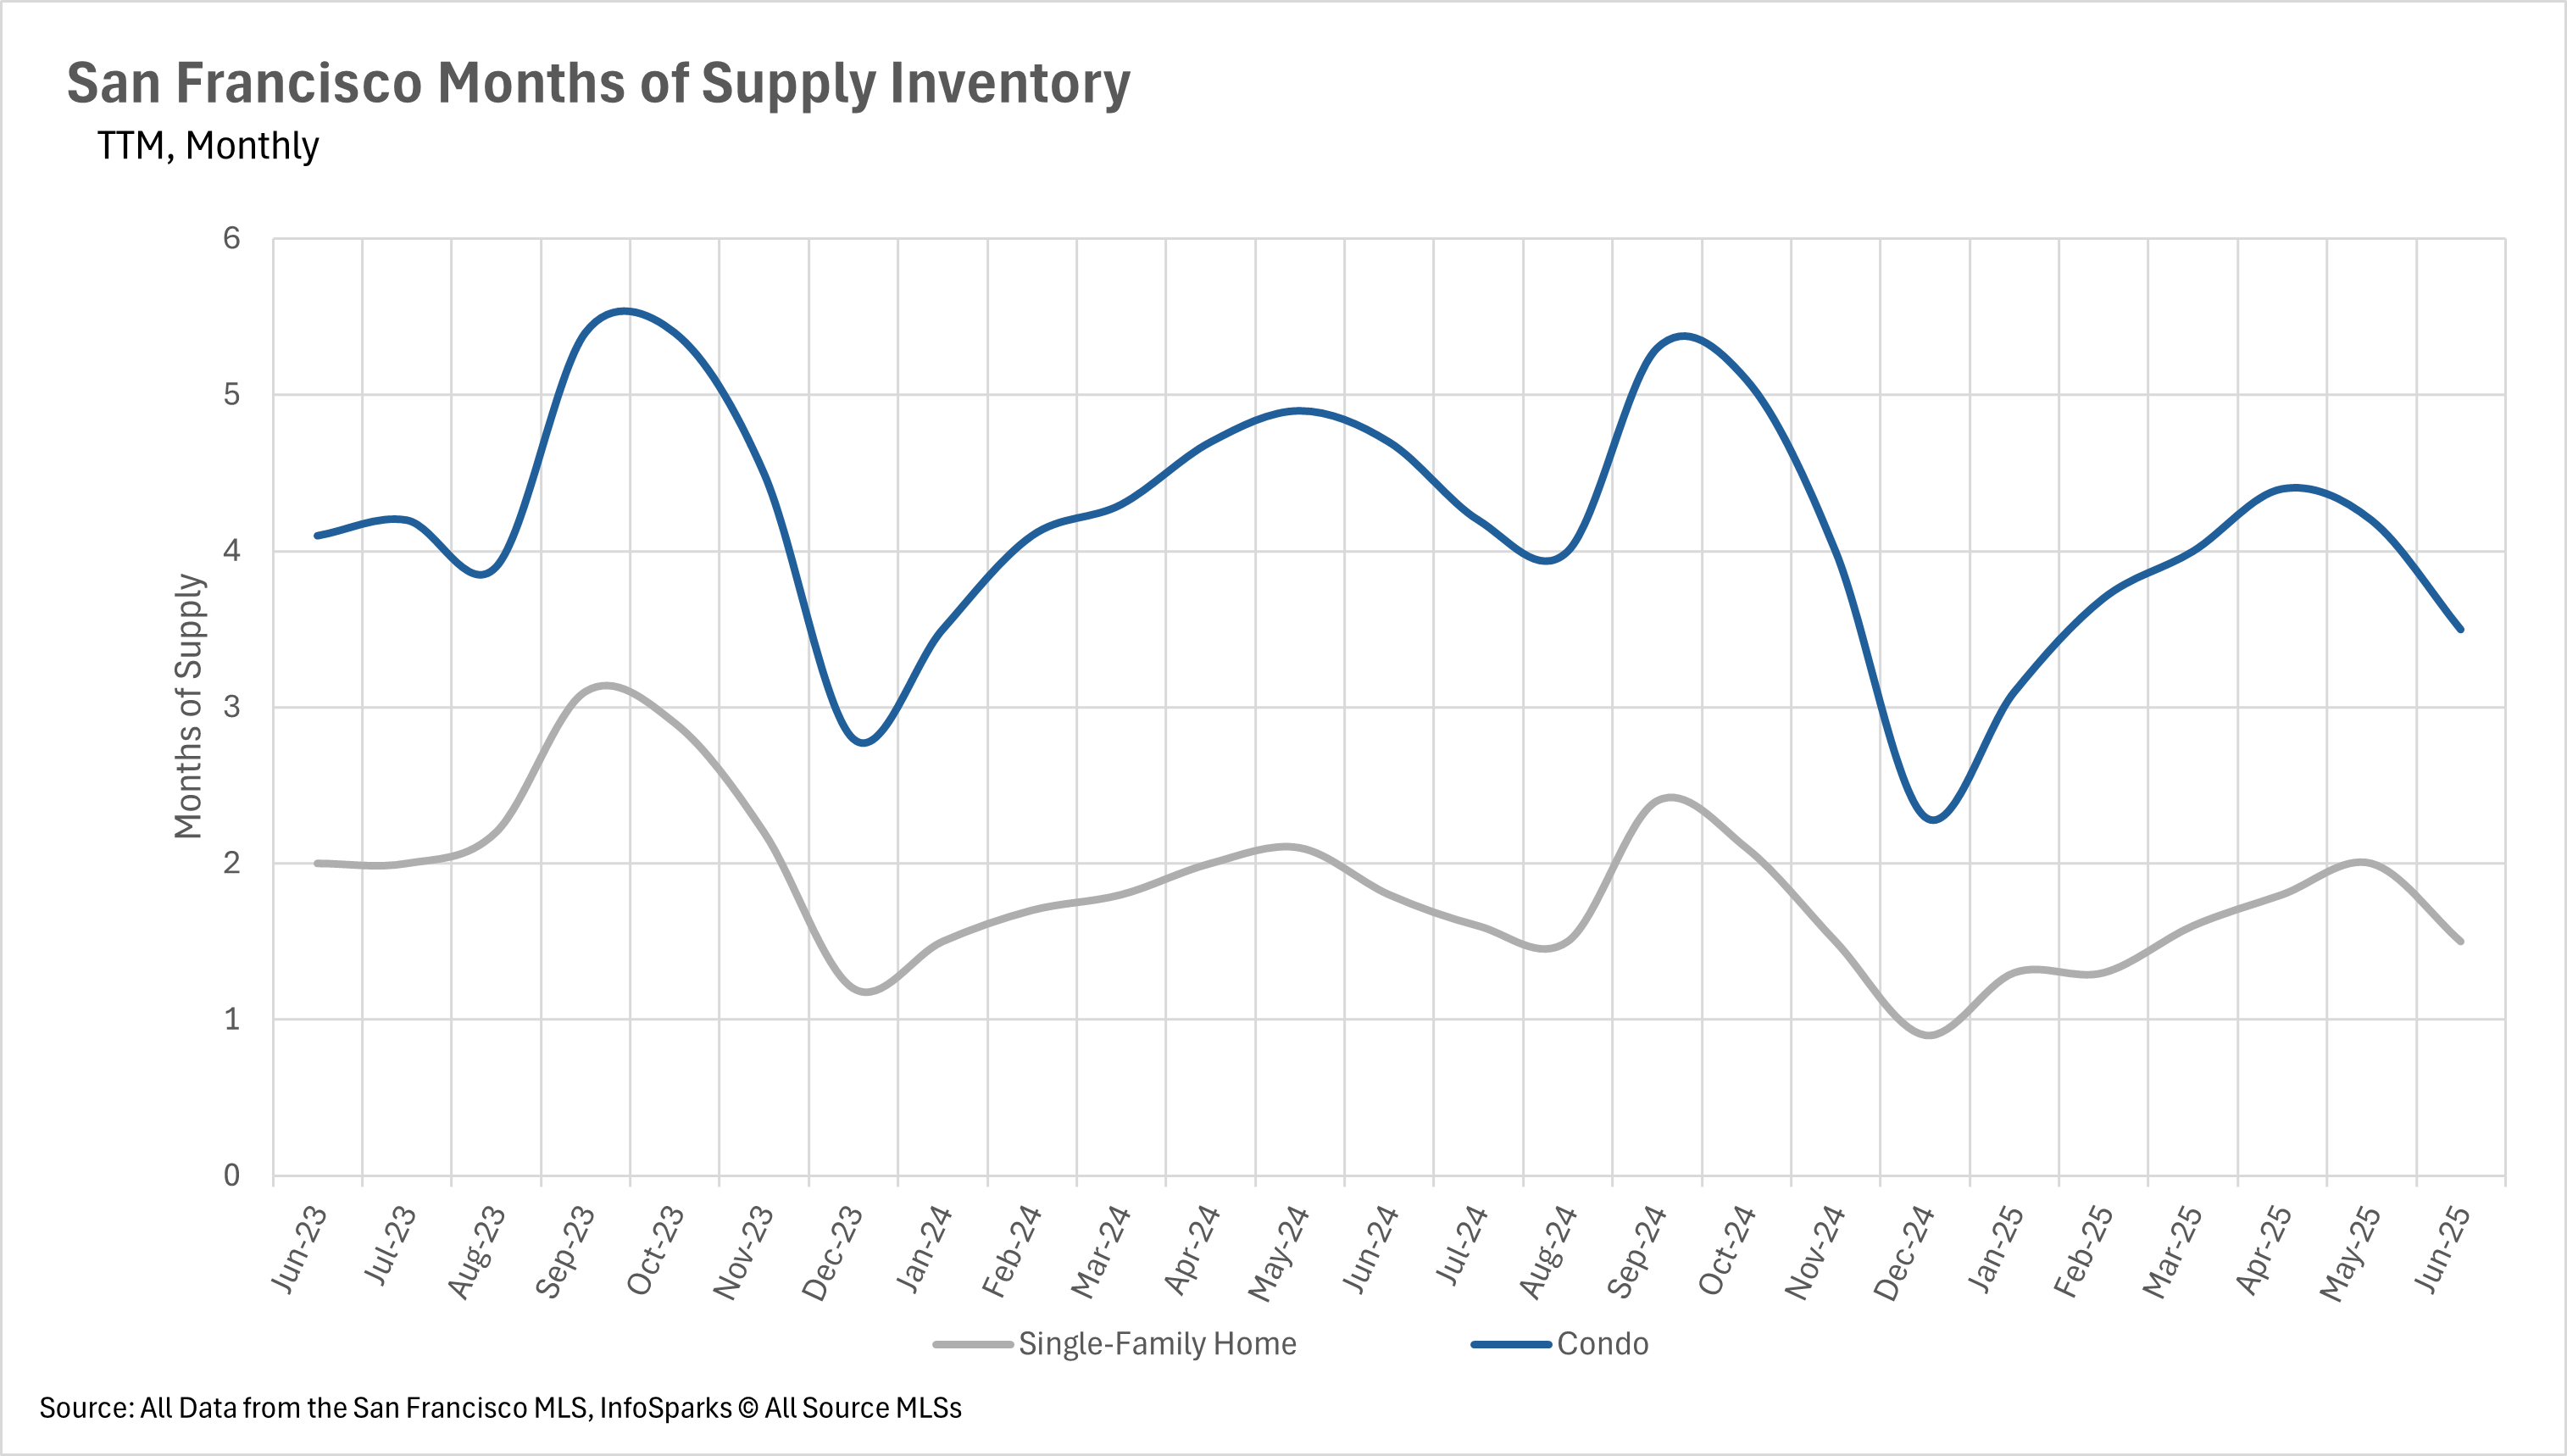
When determining whether a market is a buyers’ market or a sellers’ market, we look to the Months of Supply Inventory (MSI) metric. The state of California has historically averaged around three months of MSI, so any area with at or around three months of MSI is considered a balanced market. Any market that has lower than three months of MSI is considered a seller’s market, whereas markets with more than three months of MSI are considered buyers’ markets.
 
The single-family home market in San Francisco has been dominated by sellers for quite some time, and that did not change in the month of June, with the area having just 1.5 months' worth of inventory on the market. In the condo market, buyers are slowly losing their bargaining power as inventory levels slowly dwindle away over time. However, there’s still some room to negotiate in the condo market, with 3.5 months of supply listed for sale.
Local Lowdown Data
Chart of San Francisco home prices as a percentage of original price, comparing single-family homes and condos from June 2022 to June 2025.
Line chart comparing San Francisco condo and single-family-home days on market, June 2023–June 2025.
Chart of San Francisco condo inventory, with monthly new listings, sold listings, and for-sale listings from June 2023 to June 2025.
Chart of San Francisco single-family home listings, sales, and homes for sale from June 2023 to June 2025.
Chart compares San Francisco year-over-year median price changes for single-family homes and condos, July 2024–June 2025.
Chart of San Francisco monthly median prices for single-family homes and condos, June 2022–June 2025.
Chart comparing San Francisco condo and single-family home months of supply from June 2023 to June 2025.
Kat Rains and BarbCo Real Estate Group
Contact Us
 
Kat Rains
#02035991
45 West Portal Avenue San Francisco California 94127
415-827-8972
realestatesf.com


Let’s Talk

You’ve got questions and I can’t wait to answer them.